
About Workshop
Aim
To enable participants to leverage Artificial Intelligence and Predictive Analytics for monitoring IT infrastructure, optimizing system performance, preventing outages, and improving operational resilience through real-time anomaly detection and trend forecasting.
What Participants Will Learn
-
Teach how to apply AI to infrastructure monitoring and alerting
-
Enable development of ML-based forecasting and risk detection models
-
Train participants in real-time data processing and IT observability stacks
-
Promote proactive incident prevention and capacity planning using AI
-
Help organizations transition from reactive to intelligent, automated IT operations
Structure
Day 1: Architecture & Instrumentation of AI-Powered Monitoring Systems
🎯 Focus: AI Foundations | Telemetry Setup | Metric Collection🔹 Theory Topics:
- Introduction to AI in IT Operations (AIOps)
- Traditional vs Predictive Monitoring Approaches
- Key Components of IT Infrastructure (Cloud, On-Prem, Hybrid)
- Data Sources: Logs, Metrics, Events, Traces
- Importance of Real-Time Observability
🔧 Hands-on Lab:
- Set up Prometheus for metric collection and Node Exporter for system telemetry
- Install and configure Grafana for real-time dashboarding
- Visualize system health KPIs: CPU, memory, disk I/O
- Simulate system load using stress-ng or Docker containers
🛠️ Tools Used:
Prometheus, Grafana, Node Exporter, Docker, stress-ngDay 2: AI-Driven Analytics: Time Series Forecasting & Anomaly Detection
🎯 Focus: Data Modeling | Forecasting | Detection🔹 Theory Topics:
- Data Preprocessing for Monitoring:
- Time Windows, Lag Features, Trends
- Predictive Analytics Techniques:
- Time Series Forecasting: ARIMA, Facebook Prophet, LSTM
- Anomaly Detection: Z-score, Isolation Forest, Autoencoders
- Evaluation Metrics:
- MAE, RMSE, Precision/Recall (for anomalies)
🔧 Hands-on Lab:
- Load system metric logs and apply forecasting using Prophet or LSTM (Keras)
- Build and validate an Isolation Forest anomaly detection model
- Integrate predictions with Grafana for real-time dashboards
- Trigger intelligent alerts using Alertmanager
🛠️ Tools Used:
Python, Pandas, Scikit-learn, Prophet, Keras, Grafana, AlertmanagerDay 3: Automation, Alerting, and Scalable AI Monitoring Pipelines
🎯 Focus: Integration | Auto-Remediation | DevOps Alignment🔹 Theory Topics:
- Intelligent Alerting Systems:
- Threshold vs Behavior-Based Alerts
- Noise Reduction via Event Correlation & Suppression
- Automation Strategies:
- Auto-Remediation & Self-Healing Systems
- AIOps Workflow Design (Full-Stack)
- Use Case Spotlights:
- AI in Cloud Monitoring (AWS CloudWatch + SageMaker)
- AI for Edge & IoT Monitoring
- AI-Enhanced Cybersecurity Detection
🔧 Hands-on Lab:
- Configure alerting via Slack, MS Teams, or Webhook APIs
- Develop an auto-remediation script (e.g., restart a failing service)
- Mini-Project:
- Build an end-to-end AI Monitoring Pipeline: Metric Collection → Forecasting → Anomaly Detection → Alerting → Auto-Remediation
- Deploy a live dashboard and demo anomaly recovery in real-time
🛠️ Tools Used:
Slack API, Webhook, Shell Scripting, AWS CloudWatch, Grafana, Python, Cron JobsImportant Dates
Registration Ends
Workshop Dates
What You Will Gain
Outcomes
-
Build and deploy predictive analytics for infrastructure monitoring
-
Set up anomaly detection pipelines integrated with monitoring tools
-
Analyze and visualize metrics, logs, and events using AI-enhanced dashboards
-
Understand how to reduce downtime, MTTR, and false alerts
-
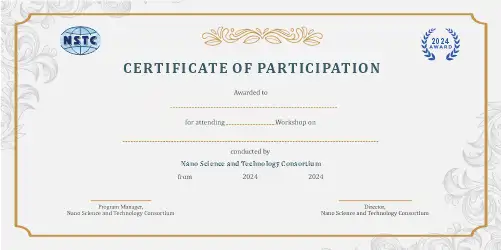
Gain certification validating your skills in AIOps and predictive monitoring
Who Should Attend
-
System administrators and IT operations teams
-
Data engineers and DevOps professionals
-
AI/ML engineers exploring AIOps and automation
-
Network security analysts and cloud infrastructure architects
-
Tech leaders seeking proactive infrastructure risk mitigation